User guide: how to use Uptrixia Monitor
This guide walks you through the core workflow: → create profiles → add hosts → configure countries & ASNs → read dashboards → and manage subscriptions and billing.
Quick checklist
What you’ll configure
- Profiles (project containers)
- Hosts (URLs/domains to monitor)
- Countries + ASN providers per host
- Frequency, timeout, start/end dates
- Dashboards, charts, billing & subscriptions
- API keys, Telegram bots & public reports
Onboarding steps
Use this as a user guide page
Profiles page: create a Profile
Your container for Hosts and monitoring config.
Add Hosts to a Profile
Domains/URLs you want to check.
Host Settings: Countries + ASN providers
Choose where checks run from.
Statuses & daily workflow
PASS / WARN / ERROR, standby, evidence.
Charts & dashboard
Compare Countries and ASNs over time.
Pricing, Billing History, Subscriptions
How plans, cycles and logs work.
API & Integrations
API Keys, Telegram bots & Public reports.
Getting started - Profiles
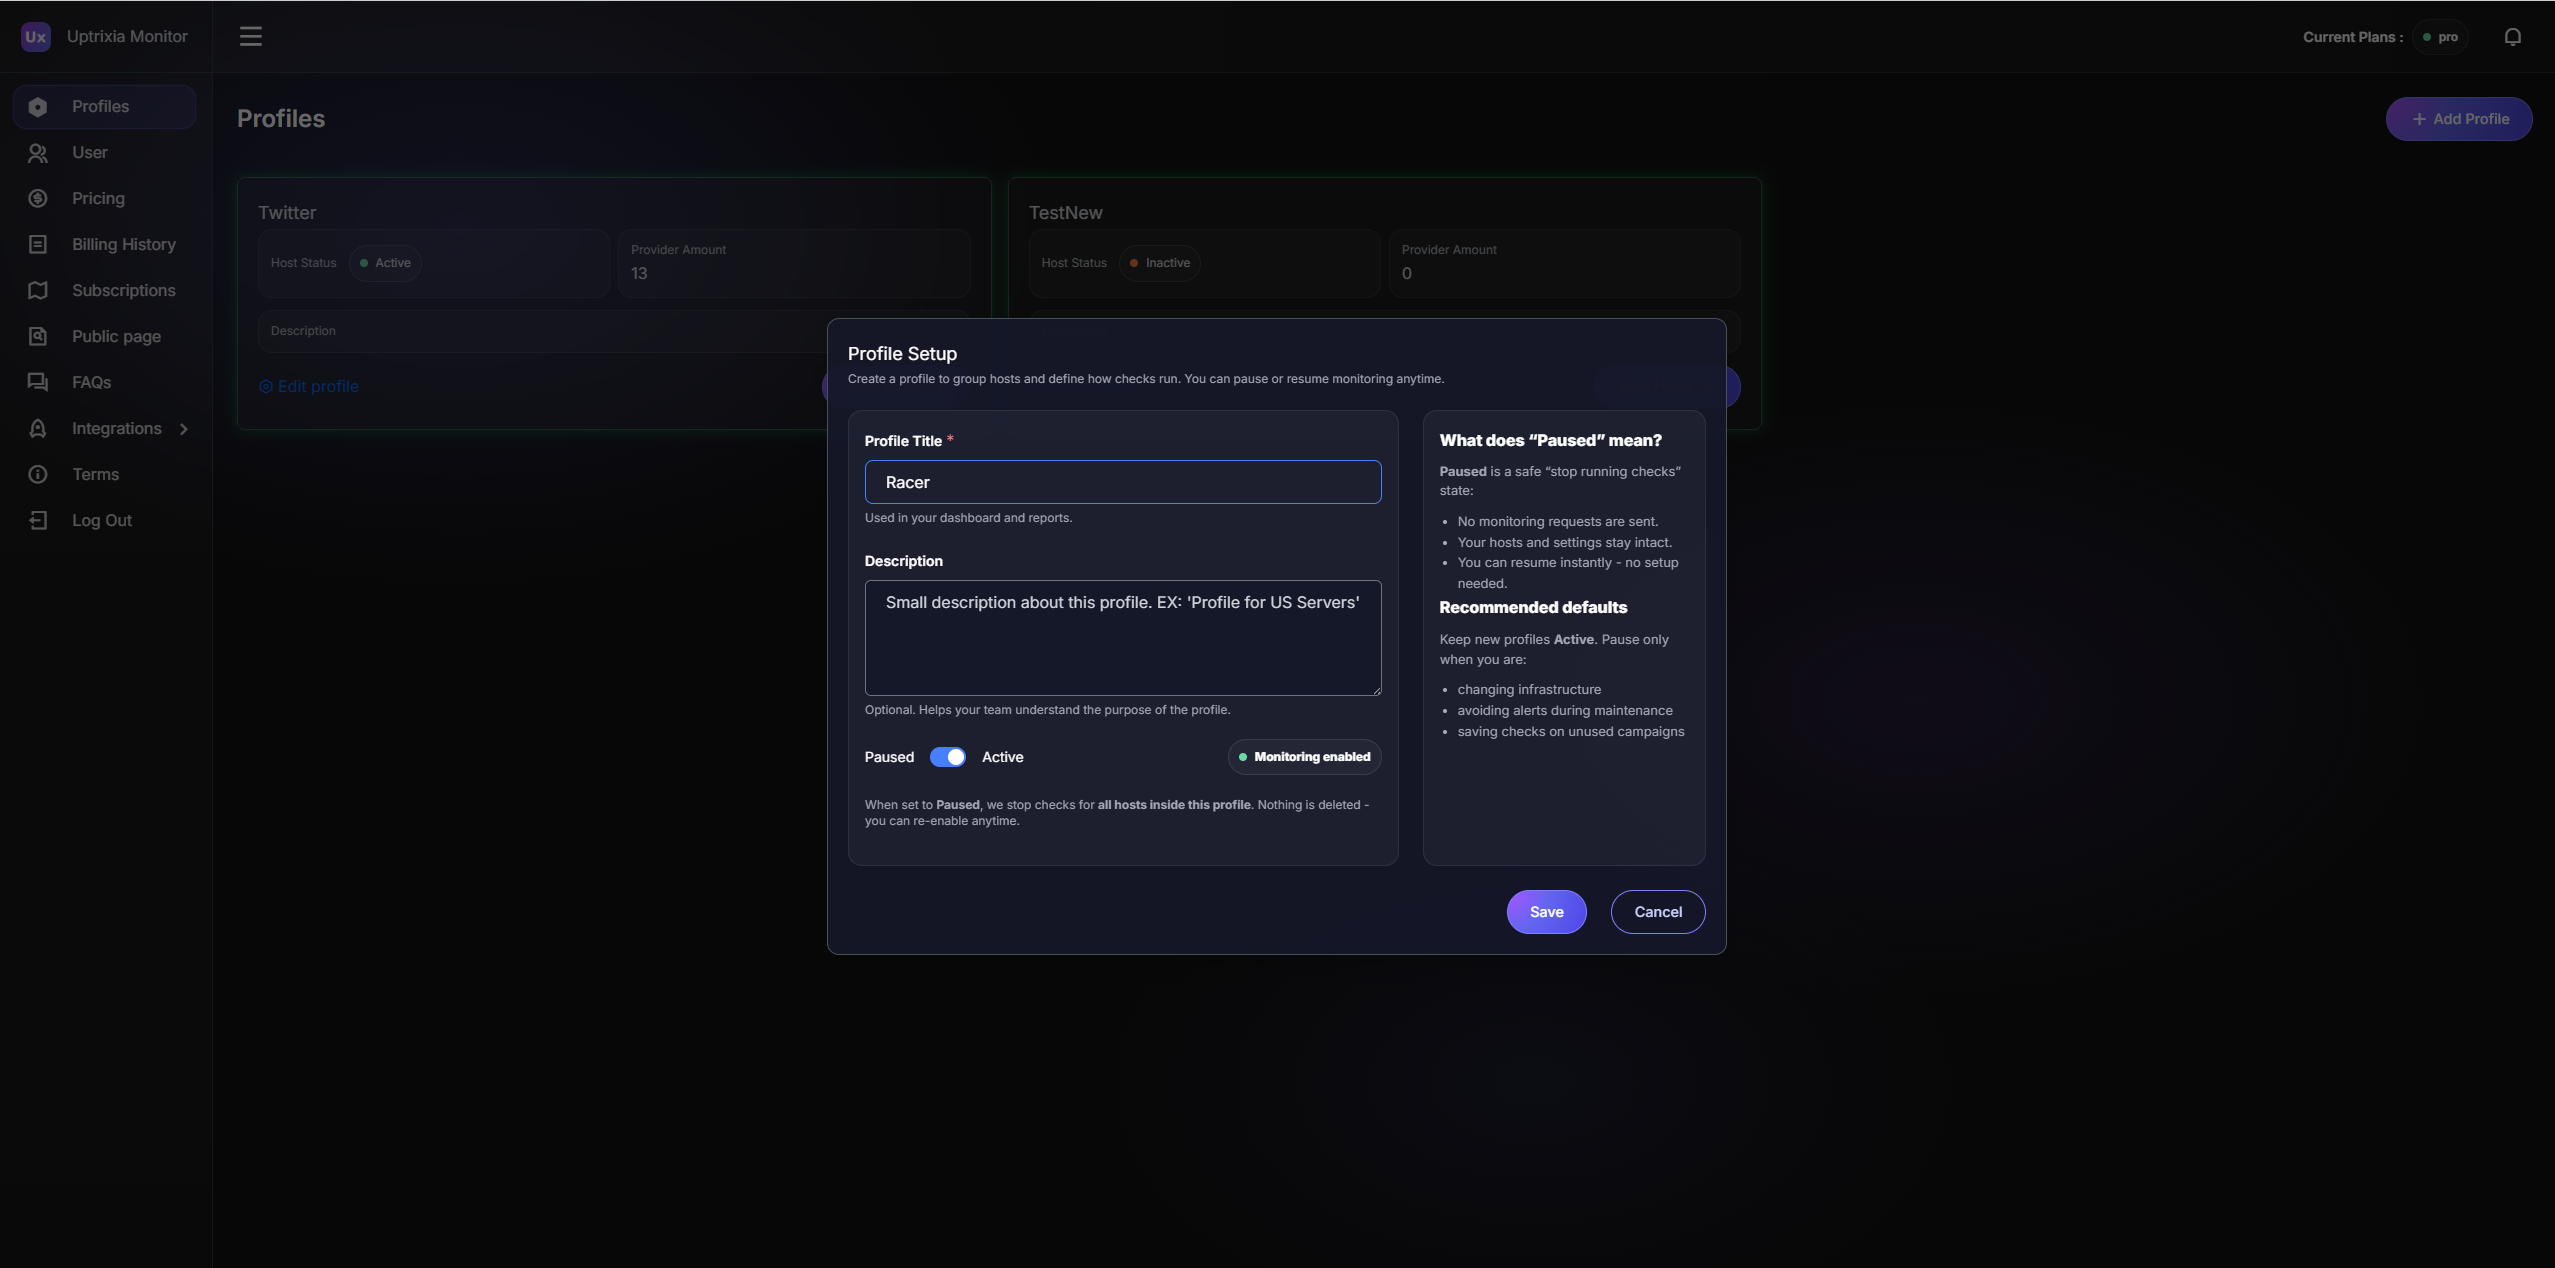
Profiles: create your workspace
Profiles are the top-level containers in Uptrixia. It groups related Hosts (domains/URLs) and keeps monitoring organized.
What you do
-
Open
Profiles from Sidebar.
-
Click + Add Profile.
-
Set a Profile Title and optional Description.
-
Use Settingsto edit, disable, or remove a Profile later.
-
You’ll see existing profiles and can add a new one.
Tip: Use one profile per project/brand/environment to keep monitoring clean and searchable. Recommended profile setup
Profile title: short, recognizable (e.g., “Main site”, “Staging”, “Campaign A”).
Description: optional notes for your team.
Adding targets — Hosts
Hosts: add what you want to monitor
A Host is the exact URL Uptrixia checks (domain, mirror,
landing page, or a specific path like /health).
Hosts always belong to a Profile.
What you do
-
Open a Profile and click View Hosts.
-
Click + Add Host to create a new check target.
-
Paste the full URL you want to monitor (domain / mirror / path).
-
Use Settings to configure monitoring (countries/ASNs, frequency, timeout, schedule).
-
If a host shows On standby — turn it on and verify start/end time in UTC.
Tip: Keep Hosts “atomic”: one URL = one check. If you need to monitor both a homepage and a deep landing, create two separate Hosts.
Configuration
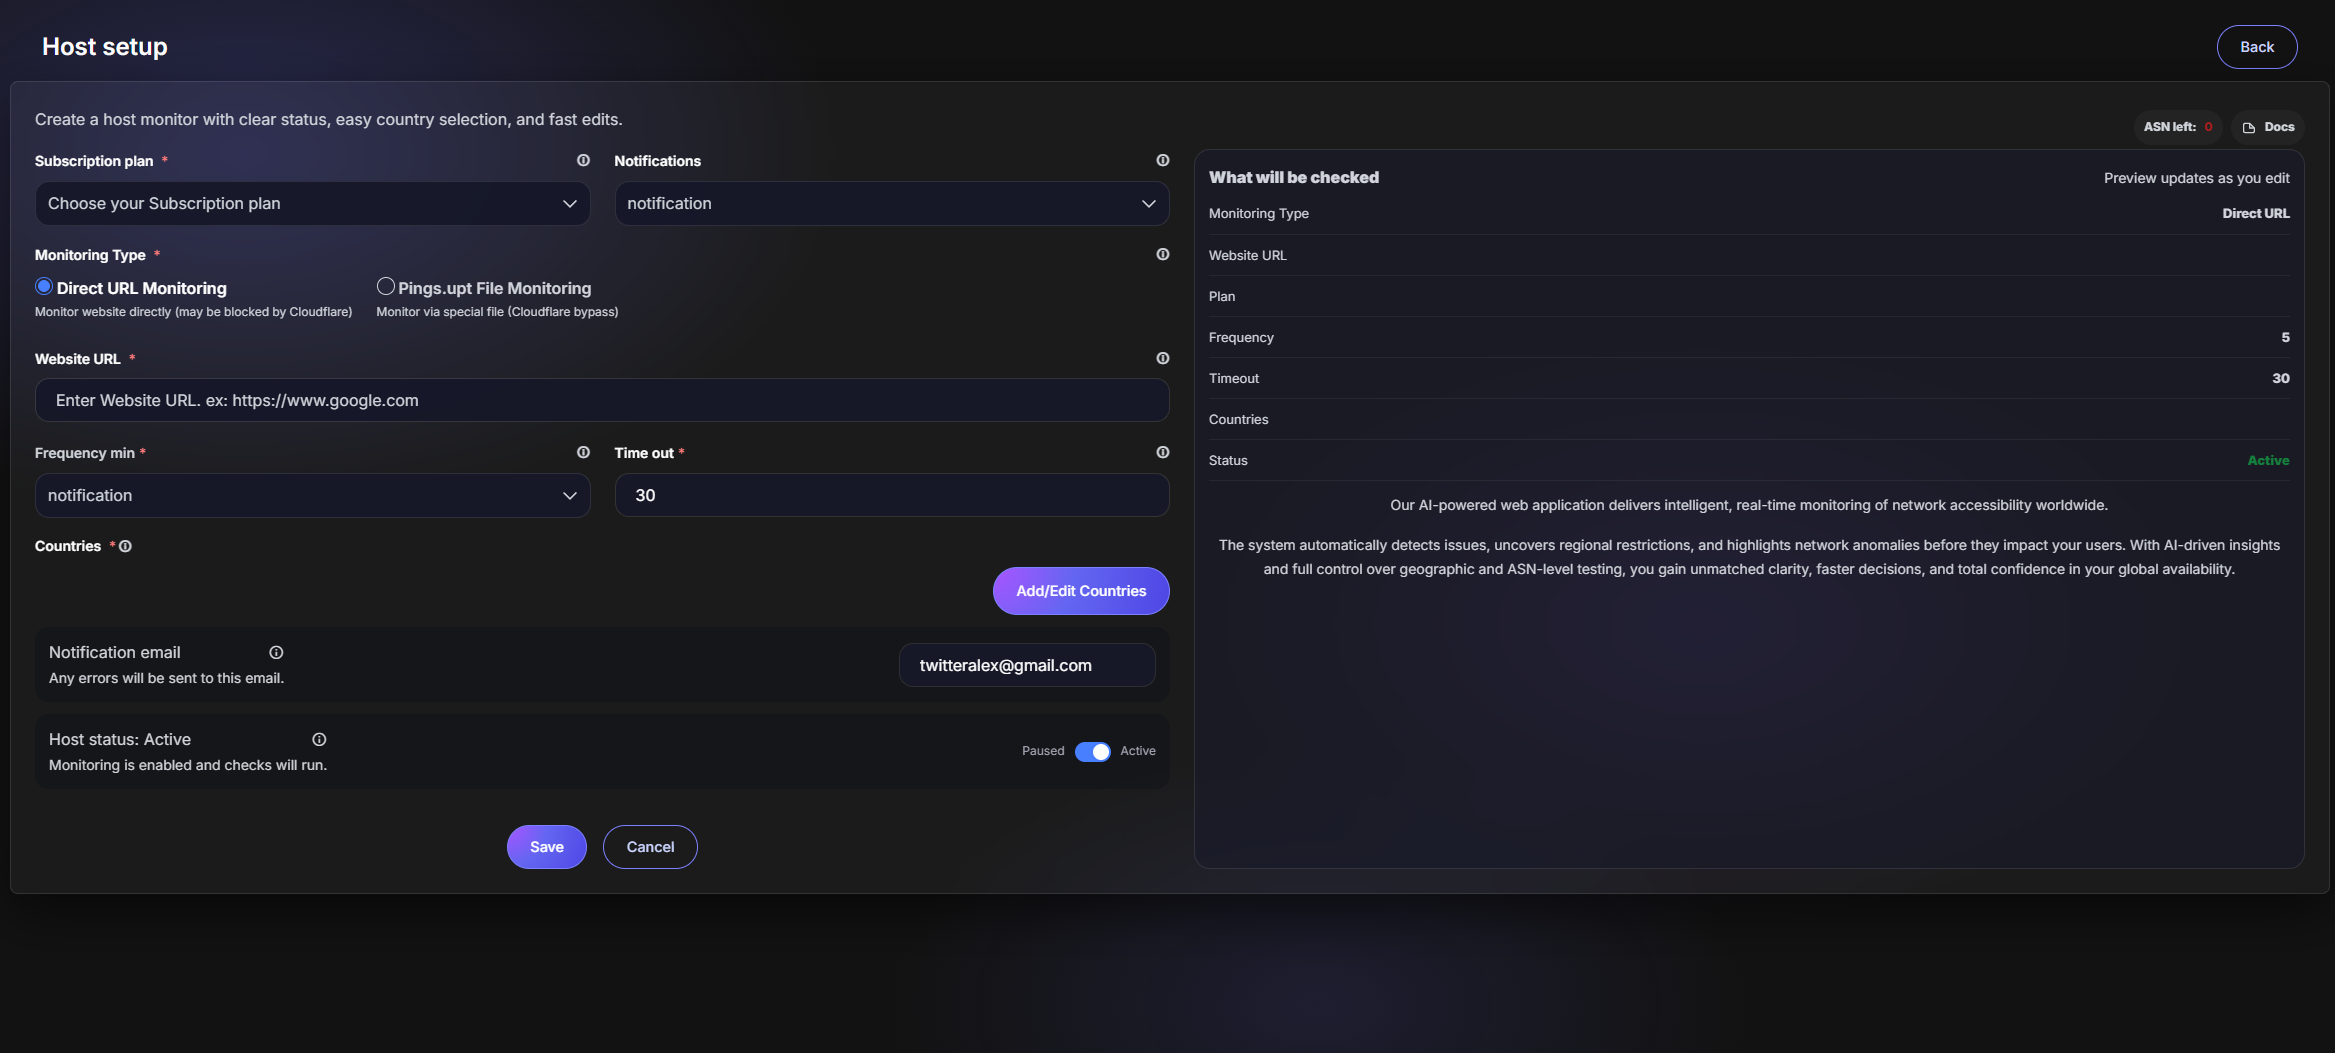
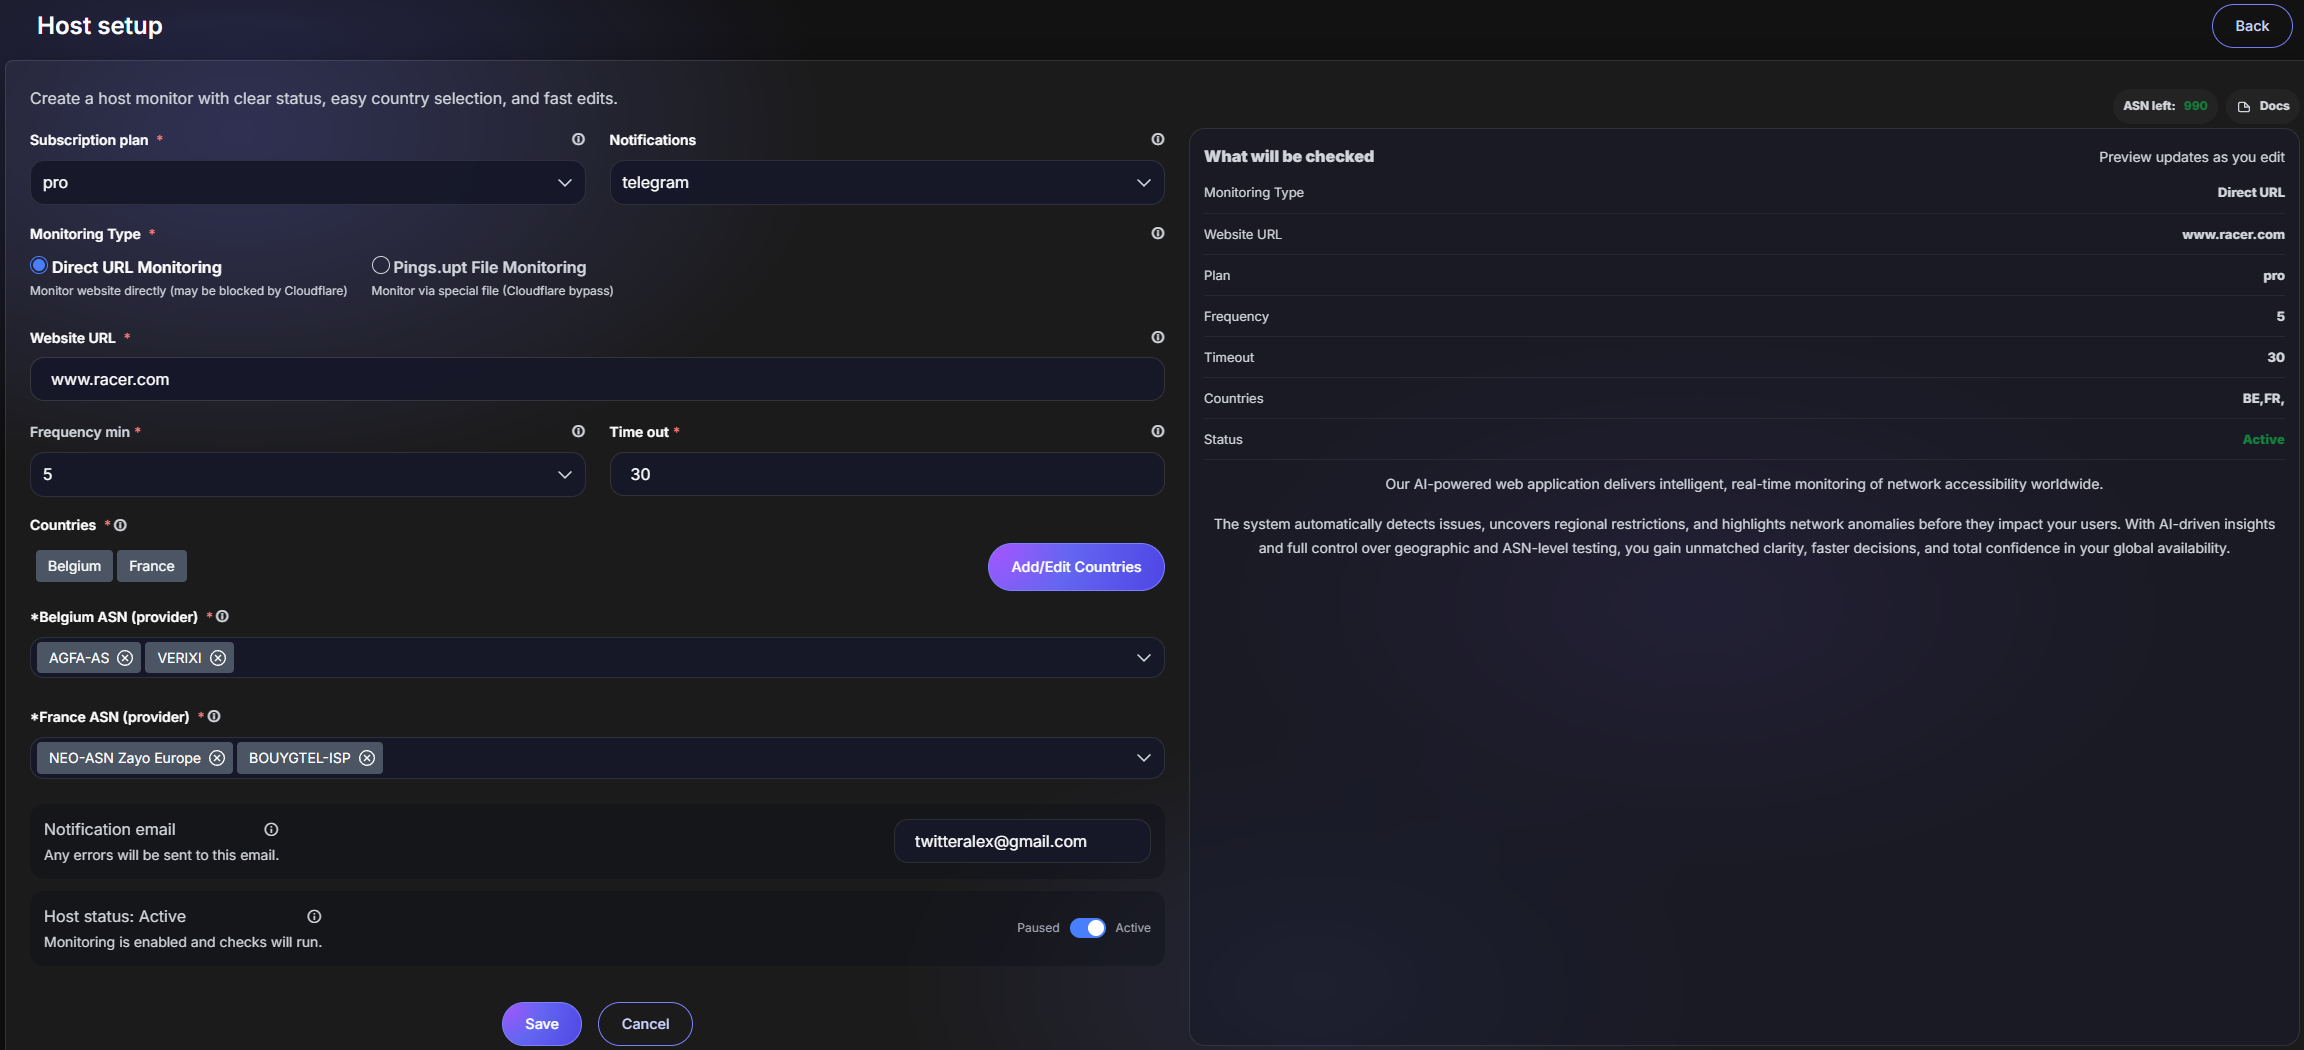
Host Settings: Countries + ASN providers
This is the main setup screen. You choose which Countries to simulate and which ASN (provider) should run checks for each country.
Fields explained
-
ASN left: remaining capacity from your plan (when it’s 0, you need to buy more).
-
Host: the URL you want to check.
-
Subscription: which plan/subscription the host uses.
-
Notification: where alerts are sent (if configured).
-
Countries: select one or more countries.
-
ASN (provider): pick one or more ISPs per selected country.
-
Frequency: how often checks run (minutes).
-
Timeout: when a request is considered failed.
-
Start / End (UTC): schedule window.
-
Active switch: pause/resume checks without losing config.
Important: ASN capacity is plan-based. If you see “ASN left: 0”, you’ll need to purchase more ASNs in Pricing.
Monitoring & workflow
Statuses & day-to-day monitoring
Once a Host is active, Uptrixia runs checks automatically. Your daily work is simple: watch statuses, open details when something changes, and act only when needed.
How statuses work
-
PASS — the site is accessible and responds normally from the selected Country + ASN.
-
WARN — the site responds, but behavior is degraded (slow, unstable, partial issues).
-
ERROR — the site is unavailable: timeout, block, bad routing or server error.
Typical daily workflow
-
Open a Profile and scan Host statuses.
-
Click View Hosts to inspect charts and recent results.
-
Compare Countries and ASN providers to see where access breaks.
-
Adjust Host settings when traffic sources, campaigns or regions change.
Tip: Most teams only react to ERROR. WARN is useful for spotting problems early — before traffic or users are affected.
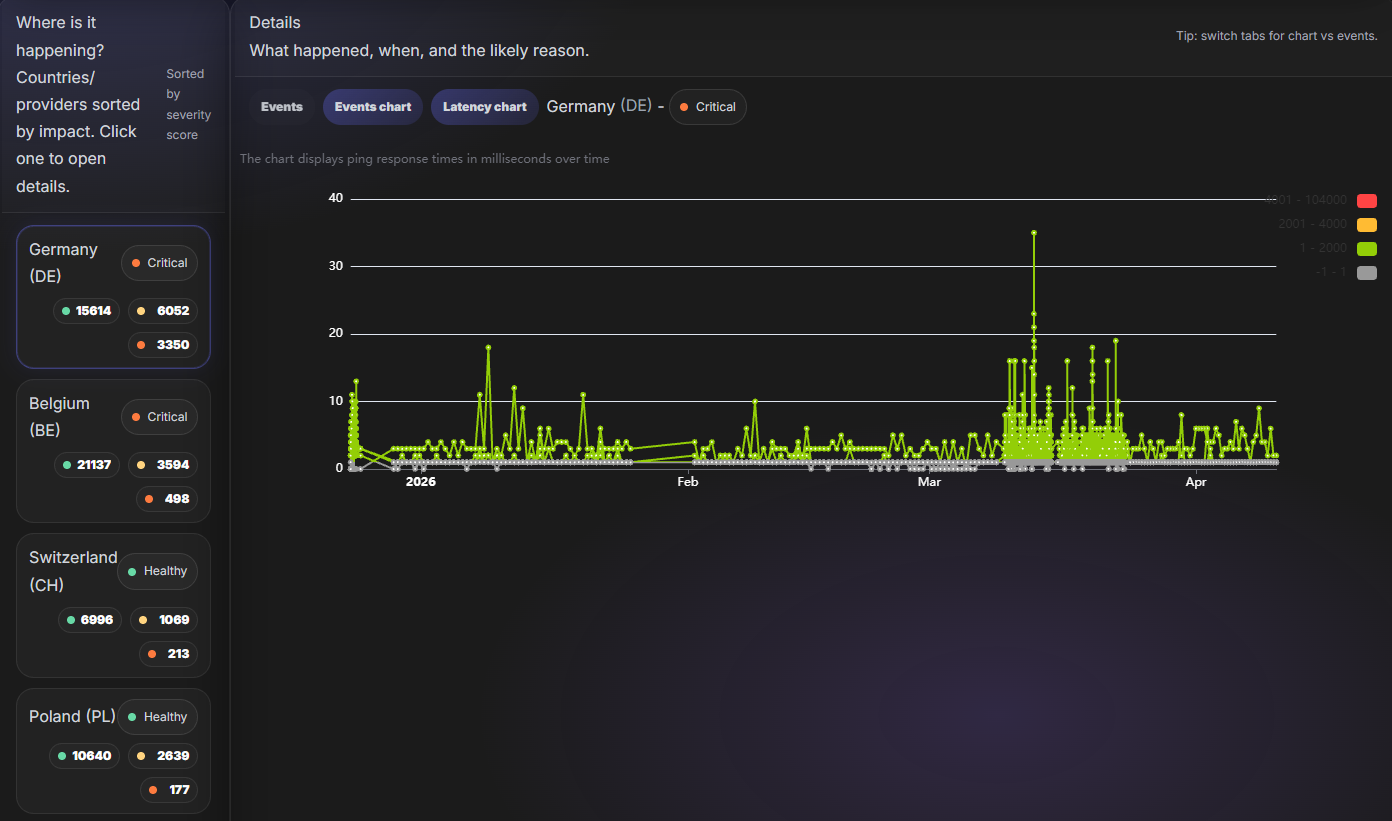
Monitoring results
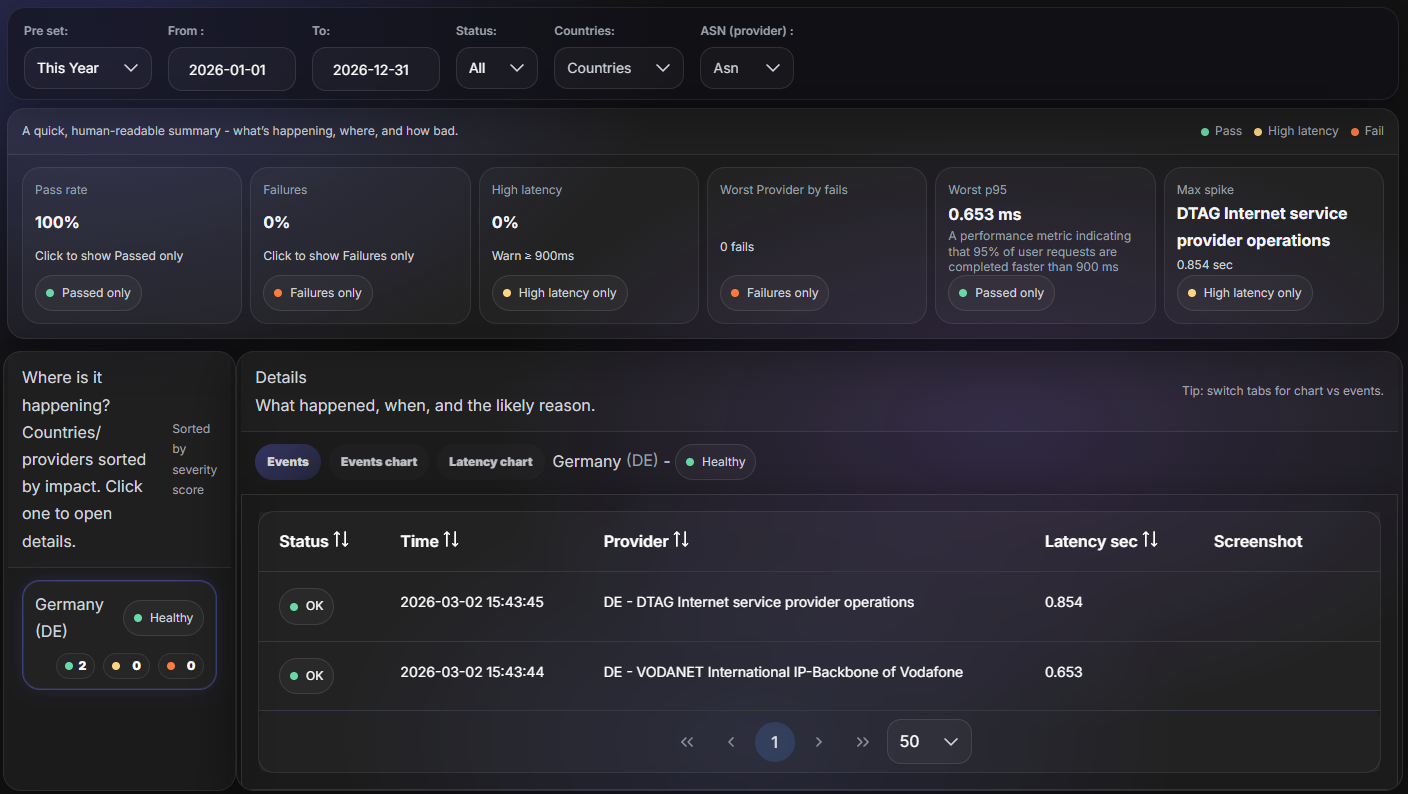
Read Charts & Dashboards
Charts help you understand where the problem happens (which country/provider) and when it started. Use filters to focus on a time range and specific Countries/ASNs.
What you’ll see
-
A sudden block of ERROR for one Country but not others.
-
A problem only on one ASN (provider) (ISP-specific filtering).
-
Spikes during certain hours (routing instability).
-
Differences between providers inside the same country.
Quick rule: Country-wide errors usually mean geo blocking or outage. Single-ASN errors often point to ISP/routing issues.
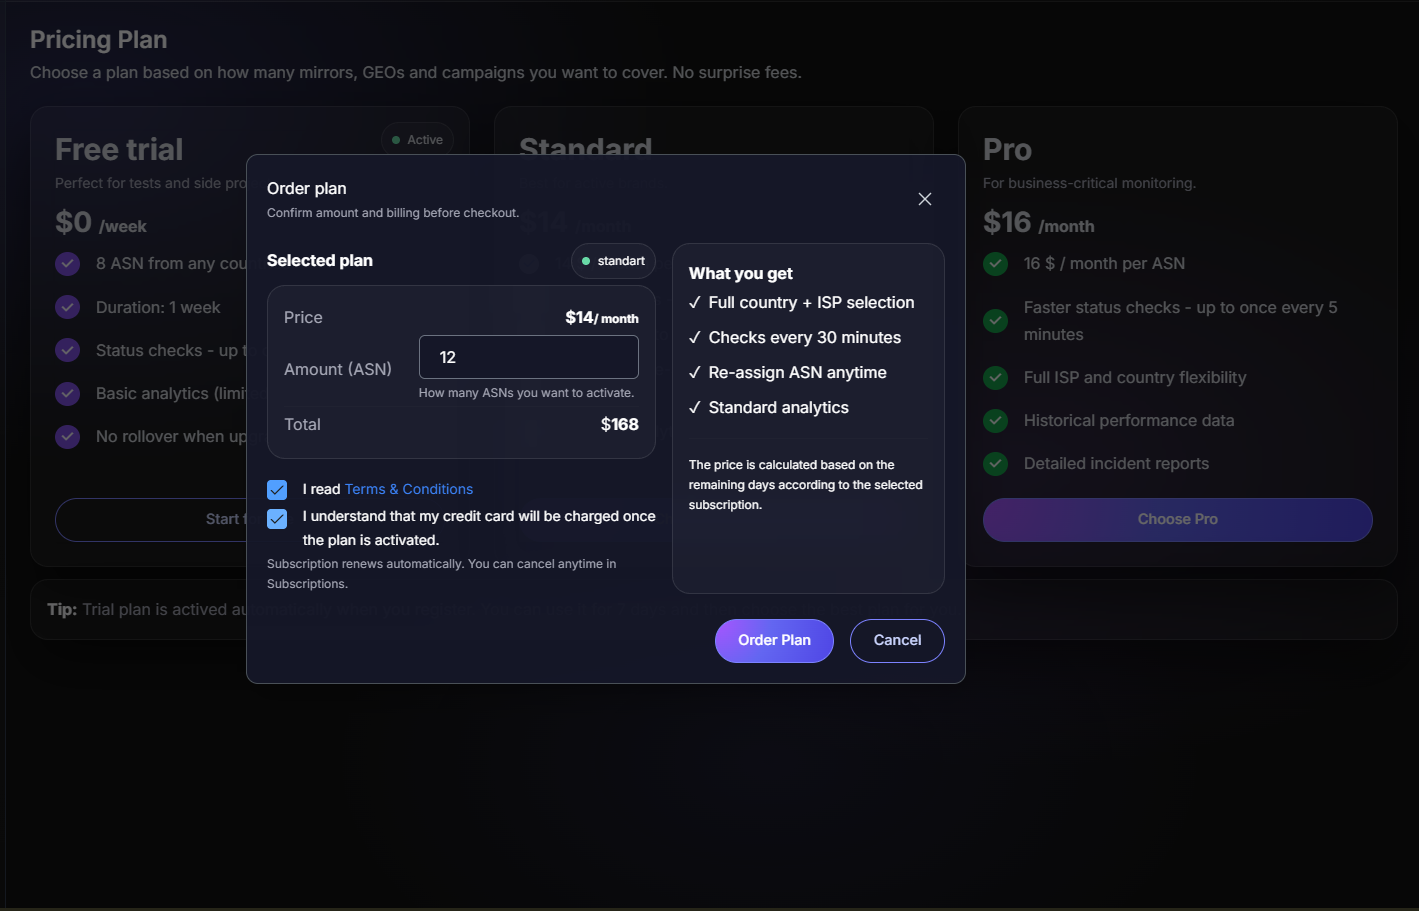
Plans & billing
Pricing, Billing History & Subscriptions
Plans are based on ASN capacity. You can add ASNs, track payment attempts, and manage subscription cycles.
How purchasing works
-
Choose how many ASNs you want.
-
Confirm Terms & Conditions.
-
Apply purchase:
-
Add to current plan: aligns with your existing plan start/end date (same renewal).
-
Extend to new one: starts a new cycle from today (separate renewal).
-
Plain example:
If you bought a plan yesterday and add more today:
-
Add to current plan keeps the original end date
-
Extend to new one starts a new end date from today.
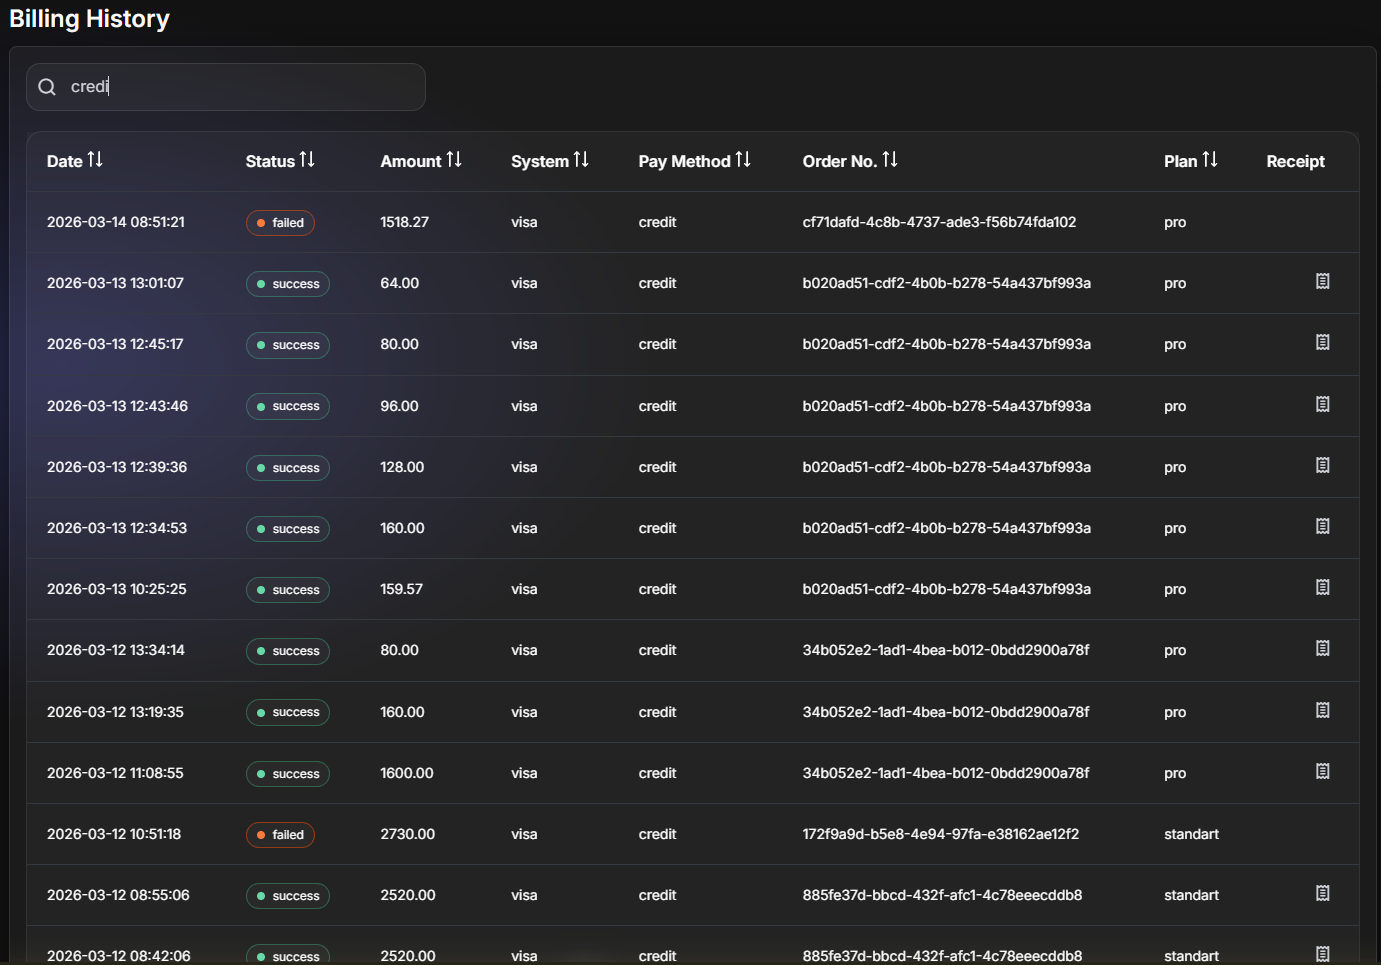
Billing History
Billing History stores every payment attempt and purchase change in one place — useful for finance and support.
Common columns
- Date
- Status (success / failed / cancel / in process)
- Amount
- Pay method
- Order No.
- Plan
- Receipt
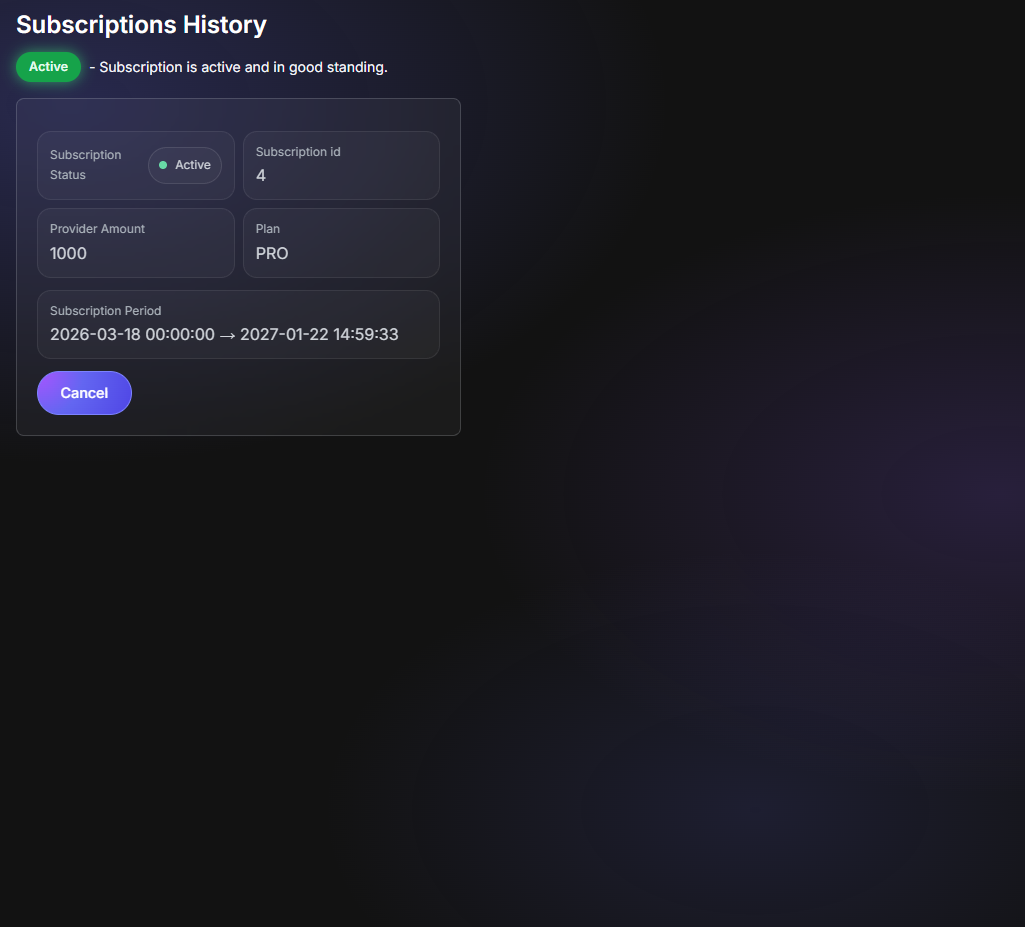
Subscriptions History
This page shows your subscription periods and lets you manage them in one click.
What you can do
- See start/end dates and plan type
- See ASN/provider amount
- Check which subscription is active
- Cancel an active subscription (one click)
API & Integrations
API Keys & Telegram Bot Setup
Extend Uptrixia's capabilities with programmatic API access and instant notifications through Telegram bots.
API Keys Management
-
Navigate to Integrations → API Keys from the sidebar.
-
Click + Generate New Key to create API access.
-
Copy and securely store the generated key.
-
Use the API to programmatically access monitoring data and build custom integrations.
Telegram Bot Setup
-
Go to Integrations → Telegram Bot.
-
Add your bot name and Telegram channel ID.
-
Receive instant downtime alerts directly in Telegram.
Use cases: API keys enable custom dashboards, automated incident reports, and integration with your existing monitoring stack.
Public Host Reports
-
Generate public report links for any host incident.
-
Share detailed incident timelines with partners or teams.
-
No account required for viewers to access reports.
-
View all public reports in Public Host View List.
Tip: Public reports are perfect for proving incidents to stakeholders or sharing evidence with support teams.
Ready to start monitoring?
Set up your first checks in minutes and stop guessing when access breaks.
Open Dashboard